How to Use Google Analytics to Grow Your Business in 2026
Have you ever walked into a physical retail store, looked around, and wondered what everyone was doing?
You can see which shelf someone walks toward. You see when someone picks up a shirt, looks at the price tag, puts it back, or walks straight to the cash register to buy it.
Now, think about your website.
Every single day, people click on your links. They land on your pages. Some leave right away. Some scroll down. Some click your buttons and buy your products. But if you do not have a tracking tool set up, you are completely blind. You are running a store with the lights turned off!
That is where Google Analytics comes in.
If you are wondering how to use Google Analytics to grow your business, you are in the exact right place. You do not need to be a math genius. You do not need to know how to write computer code. You just need to know which simple numbers matter and what action to take next.
Let’s turn on the lights together. Grab a cup of coffee, and let’s walk through this step by step, just like two friends chatting on a podcast.
What Is Google Analytics and Why Does Your Business Need It?
Let’s start with the basics.
Google Analytics (specifically the modern version called Google Analytics 4, or GA4) is a free tool made by Google. It sits quietly on your website and counts what happens.
It answers four very simple questions:
Who is visiting your website?
Where did they come from?
What are they doing while they are on your pages?
Did they buy something or contact you?
The Big Mistake Most Business Owners Make
Most people build a website, launch it, and just hope people buy. They post on Instagram, they send emails, they run an ad, and then they cross their fingers.
When sales do not happen, they panic. They say things like:
"Nobody wants my product."
"My prices are too high."
"The internet is too crowded."
Wait a second. What if people actually love your product, but your checkout button is broken on mobile phones? Or what if you are spending hours on Facebook, but 100% of your buyers are actually coming from Google search?
Without data, you are just guessing. When you guess in business, you lose money. When you learn how to use Google Analytics to grow your business, you replace guesswork with clear facts.
Getting Started: Setting Up Google Analytics 4 Without Any Headache
Before you can grow, you need to collect data. Setting up GA4 takes only about 10 minutes. Here is the easiest way to do it.
Step 1: Create Your Free Account
Go to the official Google Analytics website.
Sign in with your regular Google account (like your Gmail).
Click the gear icon at the bottom left called Admin.
Click Create Account and type your business name.
Step 2: Set Up a Property and Data Stream
A "Property" just means your website or app.
Enter your website name, pick your country, and set your local currency and time zone. (This is important so your sales data matches your local bank statements!)
Next, click Web when it asks for your platform.
Type in your website URL (like
mybusiness.com).
Step 3: Add the Tracking Tag to Your Website
Google will give you a little code snippet, or a short code called a Measurement ID (it starts with G- followed by letters and numbers).
If you use WordPress, install a free plugin like Site Kit by Google or paste the code into your header.
If you use Shopify, Wix, or Squarespace, you usually just copy and paste that
G-ID into your settings box.That’s it! Within a few hours, data will start rolling in.
Understanding the Dashboard: Words Made Simple
When you first open Google Analytics, you might see words that look technical. Don’t worry! Let’s translate them into plain English.
Google Term | What It Really Means |
Users | The individual people who visited your website. |
Sessions | A single visit. (If one person visits your site today and visits again tomorrow, that is 1 User and 2 Sessions). |
Pageviews | How many times a page on your site was looked at. |
Engagement Rate | The percentage of people who stayed on your site for more than 10 seconds, looked at 2 or more pages, or converted. |
Traffic Source | Where the visitor came from before clicking your link (Google, Facebook, email, etc.). |
Key Events (Conversions) | The big goal! When someone does what you wanted them to do (buys a product, fills out a form, calls you). |
Once you know these few words, the entire screen starts making sense.
4 Big Questions Google Analytics Answers for Your Growth
To make your business bigger and bring in more profit, you only need to focus on four core reports. You do not need to click every single button in Google Analytics. Stick to these four:
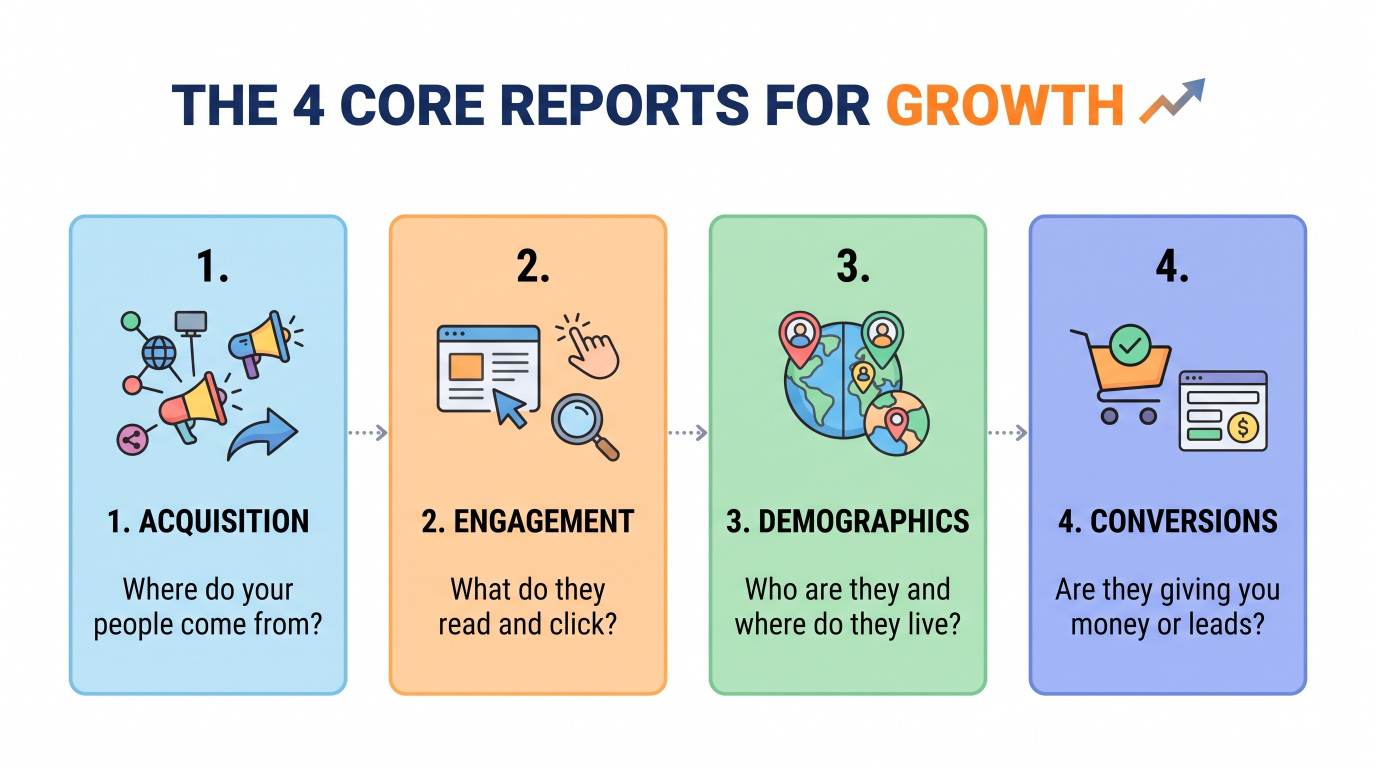
Let's dive into each one and see how they bring you more cash.
Growth Pillar 1: Find Out Where Your Best Customers Come From (Acquisition)
Imagine you have $100 to spend on marketing this week.
Should you spend it on Facebook ads? Google ads? Hire someone for SEO? Or write blog articles?
The Traffic Acquisition report tells you the answer directly.
How to Check It
In your Google Analytics left menu, click:
Reports > Acquisition > Traffic Acquisition.
Here, you will see a list of channels:
Organic Search: People who typed something into Google or Bing and clicked your free website link.
Direct: People who typed your exact URL into their browser or used a bookmark.
Paid Search: Visitors who clicked your Google Ads.
Organic Social: People who clicked your links on Instagram, TikTok, Facebook, or LinkedIn.
Email: Visitors coming from your newsletters.
Referral: Other websites that linked to you.
How to Use This Information to Grow
Look at which channel brings you the most people, but more importantly, look at which channel brings you the people who stay the longest.
If you spend 20 hours a week making videos on Instagram, but social media only brings you 2% of your visits and zero sales, stop spending all your time there!
If Google organic search brings you 60% of your visitors and they stay for 3 minutes, that means SEO is working. Double down on writing helpful articles and improving your search rankings.
Always put your money and energy where the results already are. Stop feeding channels that give you nothing back.
Growth Pillar 2: Learn What Content People Actually Care About (Engagement)
Not every page on your website is a winner. Some pages do great, while others sit completely forgotten.
When learning how to use Google Analytics to grow your business, looking at your top pages gives you a blueprint of what your audience wants to buy.
How to Check It
Go to:
Reports > Engagement > Pages and Screens.
This screen shows a table of all the URLs on your site, ordered by which ones get the most views.
Action Steps for Higher Revenue
Find your top 3 most popular pages: These are your digital storefront windows. If thousands of people read one specific blog post, put a clear call-to-action (CTA) inside that post! Add a link to your best-selling product or offer a free guide to collect their email address.
Find pages with very low engagement time: If you wrote a 2,000-word product review, but people only stay on the page for 8 seconds, something is wrong. Maybe the page loads too slowly? Maybe the title was clickbait? Maybe the font is hard to read? Fix the headline, make the text easier to scan, and add helpful pictures.
Update your winners regularly: If a blog post written two years ago brings in hundreds of visitors every month, refresh it! Add new examples, update outdated links, and make sure your current products are featured clearly.
Growth Pillar 3: Understand Who Is Visiting Your Website (Demographics & Tech)
Do you know who is actually buying from you?
You might think your ideal customer is a 25-year-old in the United States browsing on an iPhone. But what if your real buyers are 45-year-olds in Canada using desktop computers?
If you guess wrong, you will waste money on ads aimed at the wrong people.
Look at Demographics
Go to:
Reports > User attributes > Demographic details.
Here you can see:
Countries and Cities: Where your audience lives. If you see high traffic from Australia or the UK, you might want to show local shipping options or display prices in their currency.
Languages: What language their browser uses. This tells you if you need to translate your main sales pages.
Look at Tech Details (Mobile vs. Desktop)
Go to:
Reports > Tech > Tech details.
Look at the column called Device category. It breaks down your traffic into:
Mobile
Desktop
Tablet
Why this matters so much:
Many business owners design their website on a nice, big laptop screen. It looks gorgeous! But when 80% of your visitors open your site on a small phone, the text might be tiny, the images might load slowly, or the buttons might be impossible to tap.
If your engagement rate or sales on mobile are much lower than on desktop, test your website on your phone right now. Go through the checkout process yourself. If it feels annoying or clunky, fix it immediately. You are losing money every single hour.
Growth Pillar 4: Track Your Sales and Leads (Key Events & Conversions)
Let’s be honest: traffic does not pay your bills. Sales and leads pay your bills.
A website with 500 visitors a month that makes 20 sales is much better than a website with 50,000 visitors that makes zero sales.
In Google Analytics, we track important business actions using Key Events (previously called Conversions).
What Counts as a Key Event?
A key event is any action that brings money or value to your company:
Buying a product (an e-commerce checkout)
Filling out a contact form
Booking a free discovery call
Subscribing to an email newsletter
Clicking a "Call Us Now" phone number link
How to Set Up Key Events
In the bottom-left corner, click Admin.
Under Property display, click Events.
Google Analytics already tracks some things automatically (like page views, scrolls, and clicks).
If you have a "Thank You" page that shows up only after someone buys or sends a message (for example:
[yourwebsite.com/thank-you](https://yourwebsite.com/thank-you)), you can create a custom event that fires every time someone reaches that page.In the events list, flip the little switch that says Mark as key event.
Now, your reports will show you which traffic sources, which blog posts, and which countries actually bring you paying customers!
5 Practical Ways to Use Google Analytics to Increase Your Sales
Now that you know your way around the tool, let’s talk about pure strategy. Here are five simple, proven recipes you can use this week to make your business bigger.
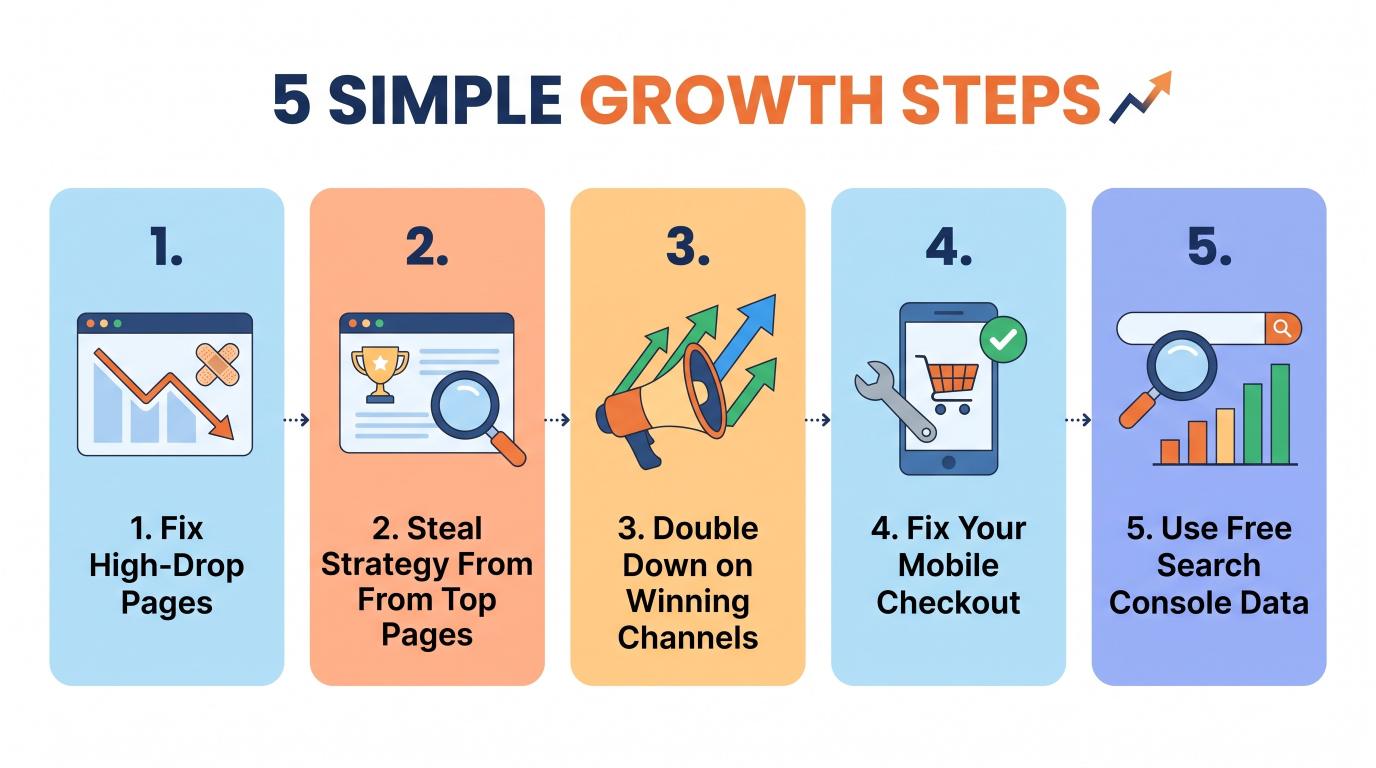
1. Fix the Pages Where People Leave Too Fast
Look at your traffic reports and identify pages that receive lots of visitors but have very low engagement time (under 10 or 15 seconds).
The Fix:
Put your main answer or offer right at the top. Do not make people read through a huge wall of text before getting to the point.
Use short paragraphs, bullet points, and subheadings.
Make sure your page loads in under 3 seconds. Check your image file sizes; huge images slow down pages fast.
2. Copy the Success of Your Best Pages
Look at the pages that have the highest engagement rate and the most conversions. Ask yourself:
Why does this page work so well?
Is the headline catchy?
Is the call-to-action super clear?
Does it solve a painful problem for the reader?
Take whatever works on that page and use that exact same layout, tone, and format on your other pages.
3. Cut Marketing Waste and Reinvest in Winners
Look at your Traffic Acquisition report every month.
If you are paying someone $500 a month to manage Pinterest, but Pinterest only brought you 3 visitors and $0 in sales over the last 90 days, cancel that contract!
Take that $500 and spend it on Google Ads or SEO content creation that is already proven to bring you paying clients.
4. Create Better Email Sign-up Offers
If you see lots of traffic to your blog, but nobody is joining your email list, your offer might be too generic.
Instead of a boring button that says "Subscribe to our newsletter," look at what people are reading.
If your top article is about "How to train a puppy," offer a free download: "Download our 3-day puppy potty training checklist."
Link the freebie directly to the topic of the page. You will see your sign-up rates jump significantly.
5. Connect Google Search Console for Free Keyword Gold
Google Analytics pairs directly with another free tool called Google Search Console.
When you link them together:
You can see the exact search terms people type into Google before they click on your site.
You can find keywords where you rank on page 2 of Google (positions 11 through 20).
By adding a few paragraphs answering those specific search queries to your existing pages, you can easily jump to page 1 and double your traffic for free.
Common Google Analytics Mistakes You Should Avoid
When people first start using web analytics, they often fall into a few traps. Let’s make sure you avoid them:
Mistake 1: Checking Real-time Data All Day Long
The Realtime report shows you what is happening on your site right this second. It is fun to watch little dots move on a world map. But watching it all day is a giant waste of time!
Business trends happen over weeks and months, not minutes. Check your data once a week or once a month. Make smart decisions based on trends, not tiny moment-to-moment spikes.
Mistake 2: Counting Your Own Visits
When you work on your website, you open pages, click buttons, and test things out. If you do not filter out your own IP address, your data will show that your site is getting visitors who stay for hours. That ruins your data accuracy!
Go to your Admin settings, find your Data Stream, and set up an internal traffic filter with your home or office IP address. That way, Google only counts real customers.
Mistake 3: Chasing "Vanity Metrics"
A vanity metric is a number that looks pretty but does not make you money.
Example: Having 100,000 pageviews is nice, but if nobody buys, it doesn't help you pay rent.
Always focus on actionable metrics: conversion rate, engagement rate, email sign-ups, and sales revenue.
Frequently Asked Questions (FAQ)
Is Google Analytics really 100% free?
Yes. Google Analytics is completely free for small, medium, and even most large businesses. There is a paid version for gigantic enterprises called Analytics 360, but standard businesses will never need it.
How long does it take to see results after setting up Google Analytics?
Google Analytics starts collecting data the moment you install the tracking code. However, you will usually need at least 2 to 4 weeks of traffic data before you can spot clear patterns and make reliable business decisions.
What is the difference between Google Analytics and Google Search Console?
Think of it this way:
Google Search Console tracks what happens before someone arrives at your site (impressions on Google search, keyword rankings, and click-through rates).
Google Analytics tracks what happens after someone lands on your site (how long they stay, what buttons they click, and what they buy).
Both tools are free, and using them together gives you the complete picture.
How often should I check my website numbers?
For most small business owners, checking your reports once a week for 15 minutes or once a month for a deeper review is plenty. Checking every day usually causes unnecessary stress and distracts you from actually running your company.
Final Thoughts: Take Action Today
Learning how to use Google Analytics to grow your business is not about memorizing complex charts or formulas.
It is simply about listening to your customers without them having to say a single word.
Their clicks show you what they like.
Their exit pages show you where they get confused or bored.
Your traffic channels show you where to spend your marketing budget.
You do not need to do everything at once. Start small:
Make sure your tracking code is installed.
Check your top 5 pages this week.
Make sure those 5 pages look great on a smartphone.
Add a clear call-to-action so readers know what to do next.
Take it one step at a time, watch your numbers improve, and enjoy building a smarter, more profitable business!
Ready to grow your business?
Contact us today to find out how our strategies can scale your operations to the next level.
Contact Us